Project Overview
Hover over categories and map features for more information


Agronomic management
The study site is primarily managed under dryland annual crop production. Permanent grass cover is a beneficial practice that is implemented along a prominent surface drainage channel that occupies a significant portion of the field. Weed control, management of other crop species, and control of off types are key management objectives for the cooperating producers, who focus on pedigreed seed production. Crops are grown in an oilseed-cereal-pulse rotation and consist primarily of wheat, oats, canola, beans, and soybeans. In low-lying areas where excess water and salinity restrict crop production, perennial grass-alfalfa hay is maintained as ground cover.
The cropped areas of the field have been managed under zero tillage since 2017, when the cooperating producers assumed ownership. To the best of their knowledge, the field was also under zero tillage prior to that time. The cooperating producers follow the principles of 4R nutrient management and generally apply nutrients in the spring during seeding operations. Nitrogen is managed using a sufficiency approach, while phosphorus is managed using a sufficiency plus build approach. Soil nutrient sampling is performed annually by a third-party agronomist. Crop yields are monitored using a combination of yield monitors and truck scaling.

Wheat yield map showing spatial yield variability across the field. Low-yield areas (red–orange) correspond to wet, saline, or eroded zones, while higher-yield areas (green–blue) reflect better field conditions.
Climate & Weather
The study area's climate supports a wide variety of annual and perennial crops, with a typical growing season extending from May through August. Based on the Canadian Climate normals, soil temperatures show that freezing generally begins in mid to late December and thawing occurs between mid-March and early May. During the growing season, the area receives an average of 276 mm (10.9 inches) of precipitation. Soil water management is a recurring issue in the study area. Excess soil moisture accumulates in low-lying areas following the spring melt and heavy rainfall events, while water deficits commonly develop in the mid to late growing season. The combination of variable weather patterns and uneven topography often results in both excessive and limited soil moisture within the same growing season.

Long-term climate conditions in the region of the study field
Soil variability
Understanding soil properties and variability is essential for identifying effective soil management practices. At the study site, soil inspections and sampling were conducted at the study site to assess the physical and chemical characteristics of the soil, while electromagnetic mapping was used to evaluate the spatial variability across the field. The soils are predominantly loam to clay loam in texture, with drainage conditions ranging from well to poorly drained. Soil salinity is a limitation in low-lying areas.
Soils are variable across the field, as indicated by existing soil resource information (yellow soil map units) and EM38 readings (colour symbology), with variability related largely to topography

Water table conditions
Baseline shallow groundwater or water table conditions were characterized using shallow monitoring wells and automated water level loggers. The study site exhibits dynamic shallow groundwater behaviour, with water tables typically rising to near-surface elevations following the spring melt and receding throughout the growing season. Spatial variability in the water table depth strongly corresponds with the surface topography, with lower areas exhibiting shallower water table depths.
Soil Salinity
Soil salinity is a major management concern, as it can greatly limit crop productivity across the region. Saline soils can develop when water from shallow groundwater move upward through the soil and evaporate at or near the soil surface, leaving dissolved salts behind. High concentrations of salt in the soil creates drought-like conditions by reducing the plants’ ability to absorb water. Salinity of the study site was determined using electrical conductivity mapping and soil sampling. Results indicated that saline soils primarily affect the low-lying areas of the field and are at impactful levels throughout a significant portion of the field.

Soil salinity map showing high-salinity zones (red–orange) and lower-salinity areas (green), with field boundaries and monitoring plots (Plot A and Plot B) indicated for reference.
Undulating topography
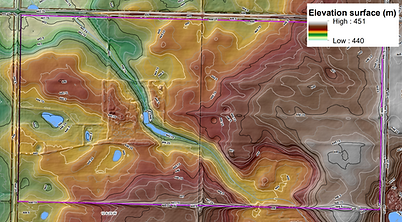
Irregular topography in the Southwestern Manitoba, where the study site is located, strongly influences water movement across the field and through the soil profile. The study site’s elevation ranges from a maximum of 451 meters above sea level in the southeast and a minimum of 441.5 meters above sea level in the northwest. A prominent surface feature is a drainage channel which extends across the study site from the southeast to the northwest, directing water towards the primary surface drainage outlet – a municipal culvert which conveys water to the north then west of the study site. All water from the area of study ultimately flows into the Souris River, which is located approximately 8.5 km to the northwest of the site. Numerous, small depressions throughout the field accumulate ponded surface water during runoff events.
Elevation map of the study field showing topographic highs and lows, closed depressional areas, and the prominent surface drainage channel running from southwest to the primary surface outlet in the northeast corner
Water runoff
Agricultural runoff often contains nitrogen, phosphorus, and salts, which can contribute to downstream water quality issues. Both natural and artificial drainage systems generate runoff that ultimately enter nearby waterways. The study field forms part of a larger water catchment and runoff area that includes land to the south and east of the study field. Upstream surface runoff flows into the field from the south and exits through a municipal culvert located at the northwest corner. From there, runoff continues northwest across agricultural land before draining into the Souris River. The Souris River then flows into the Assiniboine River and eventually into Lake Winnipeg.


Plots A and B

Research Plot A (19 ac) and Plot B (7 ac) comprise drainage management and monitoring along a slope sequence representing variability in soil properties, natural drainage conditions (i.e., relative soil water status), depth to water table and crop productivity. Plots are replicated in two similar soil-slope associations and include undrained upper slopes and tile drained upper-mid, lower-mid and lower slope positions. Tile drains are installed along slope contours at 50 ft spacings and at an approximate depth of 2.5 ft, with separate drainage outlets for each discrete landscape position for monitoring purposes.
Layout of Plot A and Plot B, including plot drainage zones, tile drain lines and drainage outlets
Field drainage zones are part of the producer-installed tile system with 50-ft lateral spacing, tile installed at approximately 2.5 ft depth, and a design drainage coefficient of 0.25 in/day. Tile drainage runoff and water quality are monitored to assess hydrology and nutrient export under field-scale tile drainage.
-
Northeast (36 ac)
-
South (59 ac)
-
Southwest (52 ac)
Field drainage zones
A weather station at the site provides continuous, real-time monitoring of weather conditions including temperature, rainfall, and windspeed. The weather station also provides estimates of evapotranspiration which is the amount of water required or being used by a crop. Evapotranspiration includes water leaving the surface of the soil through evaporation losses to the atmosphere and transpiration or uptake and use by plants. Evapotranspiration estimates are useful for irrigation and drainage management by providing an understanding of how much water is required for irrigation application and how much excess water may be recharging shallow groundwater tables.
Watchdog 3250 Wireless ET Weather Station and SpecConnect online weather monitoring dashboard
Weather station


Surface water runoff is monitored using a basic surface v-notch weir, located close to the primary surface outlet. The weir location was chosen for ease of access and construction. It captures surface runoff from the drainage area to the south and east of the study field. It accounts for most of the surface runoff from the study field and provides useful information to compare surface runoff volumes to tile drainage runoff volumes at the study field.
Surface runoff monitoring
Tile Drainage Runoff
Tile drainage runoff from Plot A, Plot B and the three field drainage zones are monitored at drainage outlets for water level, temperature, and electrical conductivity using sensors installed in in-line AgriDrainTM Water Level Control Structures. Flow rates and total flow volumes are estimated with the use of v-notch weirs in control structures.
Field drainage zones are part of the producer-installed tile system with 50-ft lateral spacing, tile installed at approximately 2.5 ft depth, and a design drainage coefficient of 0.25 in/day. Tile drainage runoff and water quality are monitored to assess hydrology and nutrient export under field-scale tile drainage.
-
Northeast (36 ac)
-
South (59 ac)
-
Southwest (52 ac)
Field drainage zones
Transects are established across Plot A and Plot B with monitoring locations positioned at each key landscape position within the research plots: upper, upper-mid, lower-mid, and lower. In addition, a shared depression monitoring location serves both plots.
At each monitoring location, soil moisture and depth to water table are monitored continuously. Soil moisture is monitored using sensors installed at six depths below the surface (30, 45, 60, 75, 90, and 105 cm), providing insight into moisture conditions both above and below the depth of tile drains. Water table depth is continuously monitored using pressure transducer level loggers to evaluate the relationship between groundwater level, ground surface, soil moisture and tile drainage systems across the study plots.
Monitoring Transects

Monitoring locations for soil moisture and depth to water table along transects in Plot A and Plot B
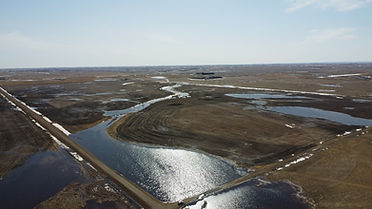
Constructed wetlands are vegetated basins that are designed to reduce nutrient and sediment losses from agricultural runoff before it reaches downstream waters by mimicking the natural filtration process of wetlands. The constructed wetland installed at the study site in Fall 2024 is designed to treat tile drainage from the Southwest Drainage Zone. It is approximately 0.75 acres in size and has a volume of 1.2 acre-feet. A saline- tolerant grass mix was seeded on the berms and harvested and conditioned cattail seeds were planed in the wetland bottom. Vegetation will be harvested on an annual basis to export captured nutrients.
Constructed Wetland
Tile Drainage Runoff
Tile drainage runoff from Plot A, Plot B and the three field drainage zones are monitored at drainage outlets for water level, temperature, and electrical conductivity using sensors installed in in-line AgriDrainTM Water Level Control Structures. Flow rates and total flow volumes are estimated with the use of v-notch weirs in control structures.
Plots A and B
Research Plot A (19 ac) and Plot B (7 ac) comprise drainage management and monitoring along a slope sequence representing variability in soil properties, natural drainage conditions (i.e., relative soil water status), depth to water table and crop productivity. Plots are replicated in two similar soil-slope associations and include undrained upper slopes and tile drained upper-mid, lower-mid and lower slope positions. Tile drains are installed along slope contours at 50 ft spacings and at an approximate depth of 2.5 ft, with separate drainage outlets for each discrete landscape position for monitoring purposes.
Layout of Plot A and Plot B, including plot drainage zones, tile drain lines and drainage outlets
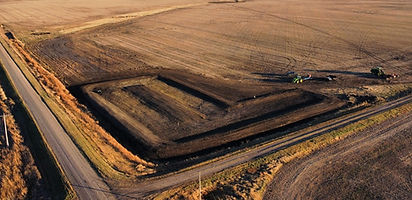
Phosphorus removal structures are systems designed to capture and remove dissolved phosphorus (P) from agricultural runoff before it enters downstream waterways. Minimizing entry of P into downstream waterways is environmentally beneficial, as P is of primary concern for surface water quality in Manitoba. The structure installed in Fall 2024 uses a steel shaving/limestone-based pea gravel mixture which bind dissolved phosphorus as tile drainage from the South Drainage Zone passes through.
Phosphorus removal structure

I'm a paragraph. Click here to add your own text and edit me. It's easy.
Research plot runoff monitoring

I'm a paragraph. Click here to add your own text and edit me. It's easy.
Research plot runoff monitoring

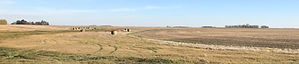
Grassed waterways are vegetated channels designed to minimize erosion during surface runoff events. At the study site, permanent grass cover is present along a prominent surface drainage channel that occupies a significant portion of the field. Grass is typically cut, baled and removed from the site in the fall for cattle feed, which helps export nutrients, particularly phosphorus, that would otherwise be prone to loss through runoff events. Grassed waterways are considered beneficial in supporting overall soil health and water conservation by improving soil stability, promoting soil health, trapping sediment in runoff, utilizing nutrients and preventing erosion and gully formation.
Grassed waterway

Proper fertilizer management used in conjunction with other beneficial management practices, can help limit nutrient losses through time drainage maintaining crop productivity. One widely used approach, which the cooperating producers follow, is the 4R Nutrient Stewardship Framework. 4R nutrient stewardship emphasizes applying the right source of nutrients at the right rate, at the right time and in the right place. When utilized correctly, these principles can reduce nutrient export and lower impact costs for farming operations.
4R nutrient stewardship

Crop yield monitoring and mapping is conducted at the site using combine-mounted yield monitors, which are confirmed using producer confirmed scale weights collected at harvest. These systems measure crop flow, moisture, and location to generate yield maps to show how crop yields vary across the field. Yield monitoring is a useful tool to evaluate management practices, identify variability, and guide decisions that improve efficiency and productivity. Yield data are being used to evaluate crop productivity under tile drainage and the cost-effectiveness of this practice in the region.
Crop yield mapping
Tile drainage is designed to remove excess water from the soil profile, improving soil health and overall crop productivity. Similar to other agricultural practices implemented on the land, there are trade-offs with the implementation of tile drainage. The shift in agricultural water balance typically results in slightly higher total field runoff but can reduce peak runoff flows. In terms of nutrients, tile drainage generally results in an increase in loss of soluble nutrient components (e.g., nitrogen, soluble phosphorus) but a reduction in total phosphorus losses. The study aims to better understand these trade-offs in variable landscapes and cold climates.
Tile drainage BMPs implemented at the study site include: 1) intensive planning, evaluation and design, 2) site-specific tile layout, 3) contour drainage, 4) shallow depth of installation, 5) monitoring tile outlets for flow and water quality.
Tile drainage
Cover crops are not currently implemented at the study site but are of interest due to the potentials benefits they provide. Cover crops provide protection against erosion, reduce sediment loss, enhance infiltration and contribute to soil health. Research is being conducted on the potential use of cover crops as a BMP for soil health and water quality in cold climates.
Cover crops
Conservation tillage, which is practiced at the site, reduces the frequency and intensity of soil disturbance to help maintain soil structure, protect surface residues, and minimize erosion. By preserving organic matter and improving infiltration, it can reduce nutrient and sediment losses through tile drainage and surface runoff. Conservation tillage also supports soil health and water quality, making it a favorable practice for both producers and the broader public.
Conservation tillage
Soil salinity can be a significant limitation to crop productivity. The two primary BMPs at a producers’ disposal for soil salinity are permanent vegetation cover and tile drainage, both of which are implemented at the study site. With the implementation of tile drainage, salts loading downstream also becomes an issue. Soil salinity monitoring allows producers to gain insight on the effectiveness of practices implemented to optimize the crop management system and minimize impacts to downstream receptors. The primary consideration for tile drainage of saline areas when it comes to water quality is to reduce the volume of runoff, mainly be installing tile as shallow as feasible. Monitoring activities at the study site aim to provide a better understanding of the effectiveness of tile drainage in reducing salinity limitations to crop productivity and resultant salt export in runoff.
Soil salinity monitoring and managment

Phosphorus removal structures are systems installed at tile or surface drainage outlets to capture dissolved phosphorus before it enters downstream waterways. Phosphorus-sorbing materials within the structure to dissolved phosphorus as water flows through the structure and are often installed at tile drainage outlets, ditch edges, or runoff control points. These structures provide targeted treatment that compliments field, soil, and downstream water quality management practices. The phosphorus removal structure at the study site is the first of its kind in Manitoba and will allow researchers to assess the effectiveness of this BMP in the cold climate of the study region.
Phosphorus removal structure
Tile runoff monitoring allows producers to evaluate the performance of installed tile drainage systems. In addition, monitoring can be used to determine the effectiveness of management practices in conserving water and improving water quality. Runoff monitoring implemented at the study site is providing insight into how much water, nutrients and salts leave the field under different conditions.
Runoff monitoring
Constructed wetlands are vegetated basins designed to slow and treat agricultural runoff and tile drainage before it leaves the field. By promoting sediment settling and nutrient removal through natural biological and chemical processes, they help reduce phosphorus, nitrogen, and sediment loading to downstream waterways. Constructed wetlands improve downstream water quality and can also provide ecological habitat and enhance landscape resilience. The constructed wetland at the study site is being monitored to confirm the effectiveness of this practice in cold climates.
Constructed wetland
The research and demonstration site is established across a 320 acre field predominantly under annual cropping for pedigreed seed production.
Baseline environmental investigations were completed to inventory field conditions to support project setup and identification of appropriate BMPs for implementation and/or evaluation.
Site-specific tile drainage improvements installed in 2021 form a major component of the soil and water management evaluation. Two components of the tile drainage system – the “commercial” field drainage zones and research plots (Plot A and Plot B) – occupy about half of the cropped field area and are both monitored for water flow and water quality.
Beneficial management practices (BMPs) considered in this evaluation include individual practices across planning, evaluation and design, agronomic management, soil health management, and water management categories.